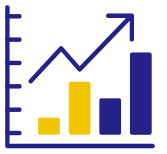
Performance monitoring solutions can provide valuable insights for making decisions such as hull cleaning, propeller polishing, vessel rehiring, and associated negotiations. With the ongoing digitalization of the shipping industry, data is available in abundance for building performance analysis tools. However, drawing actionable insights from such data can be challenging. Existing performance monitoring solutions fall short because of the following reasons:
“The differentiating factor between various performance monitoring solutions is not the machine learning algorithm how the system deals with the inputs and outputs of the algorithm. The best solutions pay attention to the data logging and validation pipelines and focus on assisting objective decisions from the outcome of the analysis.”
- Paarth Neekhara, Technical Lead at Blue Water, Computer Science PhD at UC San Diego
At Blue Water, we carefully addressed the above challenges to develop a state-of-the-art performance analysis solution. BOSS not only identifies under-performing vessels but also analyses the root cause of underperformance and suggests corrective actions. For transparent analysis, our user-friendly dashboards allow the user to deep-dive into every report used for creating vessel performance curves and trends. Let’s find out how our unique solution stands apart.
Turning data into measurable actions
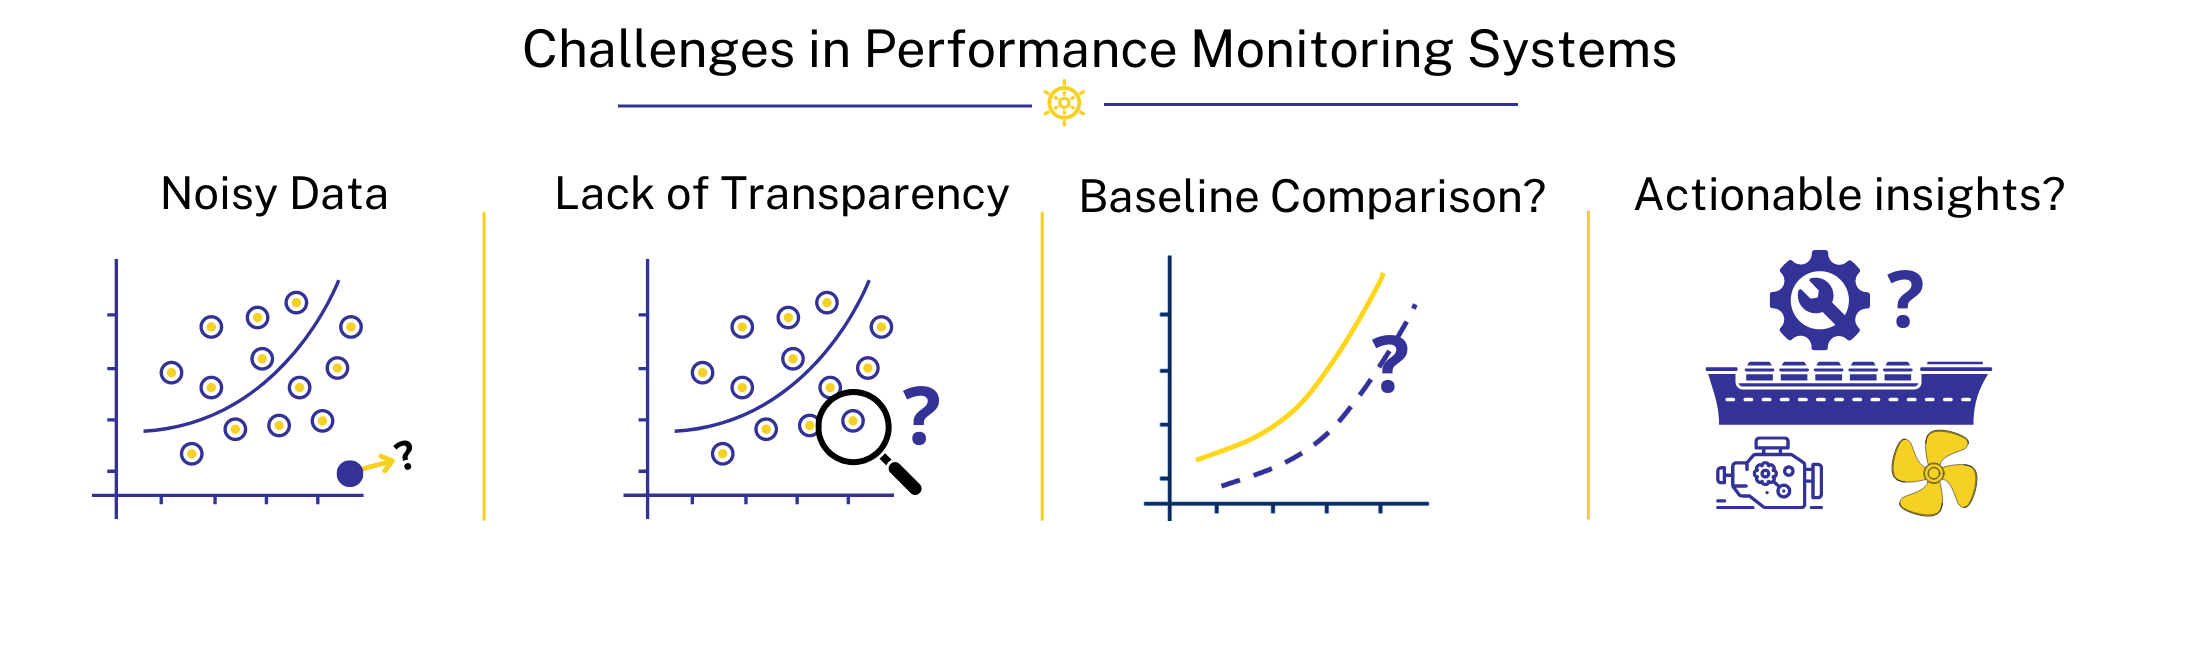
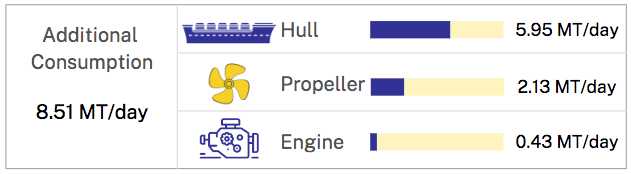
Various factors can cause an increase in fuel consumption at a given speed - hull fouling, propeller fouling or main-engine malfunctioning. BOSS tracks the added consumption of a vessel at a given speed against a baseline model. The performance trend module analyzes the speed and fuel consumption trend over time to identify performance deterioration. Next, an automatic root cause analysis is performed by analyzing the trend of different variable pairs such as RPM-Speed, RPM-Power and Power-Consumption. This root cause analysis apportions the increase in consumption at given speed into hull, propeller or engine issues thereby suggesting corrective actions.
The performance trend module can also accurately quantify the savings obtained by conducting hull cleaning, propeller polishing, or dry-docking operation. A savings report can be exported and generated by analyzing vessel performance before and after a vessel maintenance event. The timeline of the performance trend graph tracks all the vessel maintenance events, idle days, and performance data points in both laden and ballast passages. This event tracking helps quickly analyze the impact of hull cleaning, idle days in tropical waters, etc. on vessel performance.
“Quantifying fleet performance accurately has always been a big challenge. Intelligence derived from validated performance data can be applied by both technical and chartering teams for making quick informed decisions when they are needed the most.”
- Capt. Kumaresh Gupta, Managing Director Blue Water
Data Sourcing and Validation
BOSS performance modules can consume data from noon reports and also sensor data API. Sensor data promises noise-free and accurate data logging. However, miscalibrated sensors, hardware, and network issues can result in missing or inconsistent data. Also, many commercial and compliance reports like emission reports and performance claims are exclusively based on the reported noon data.
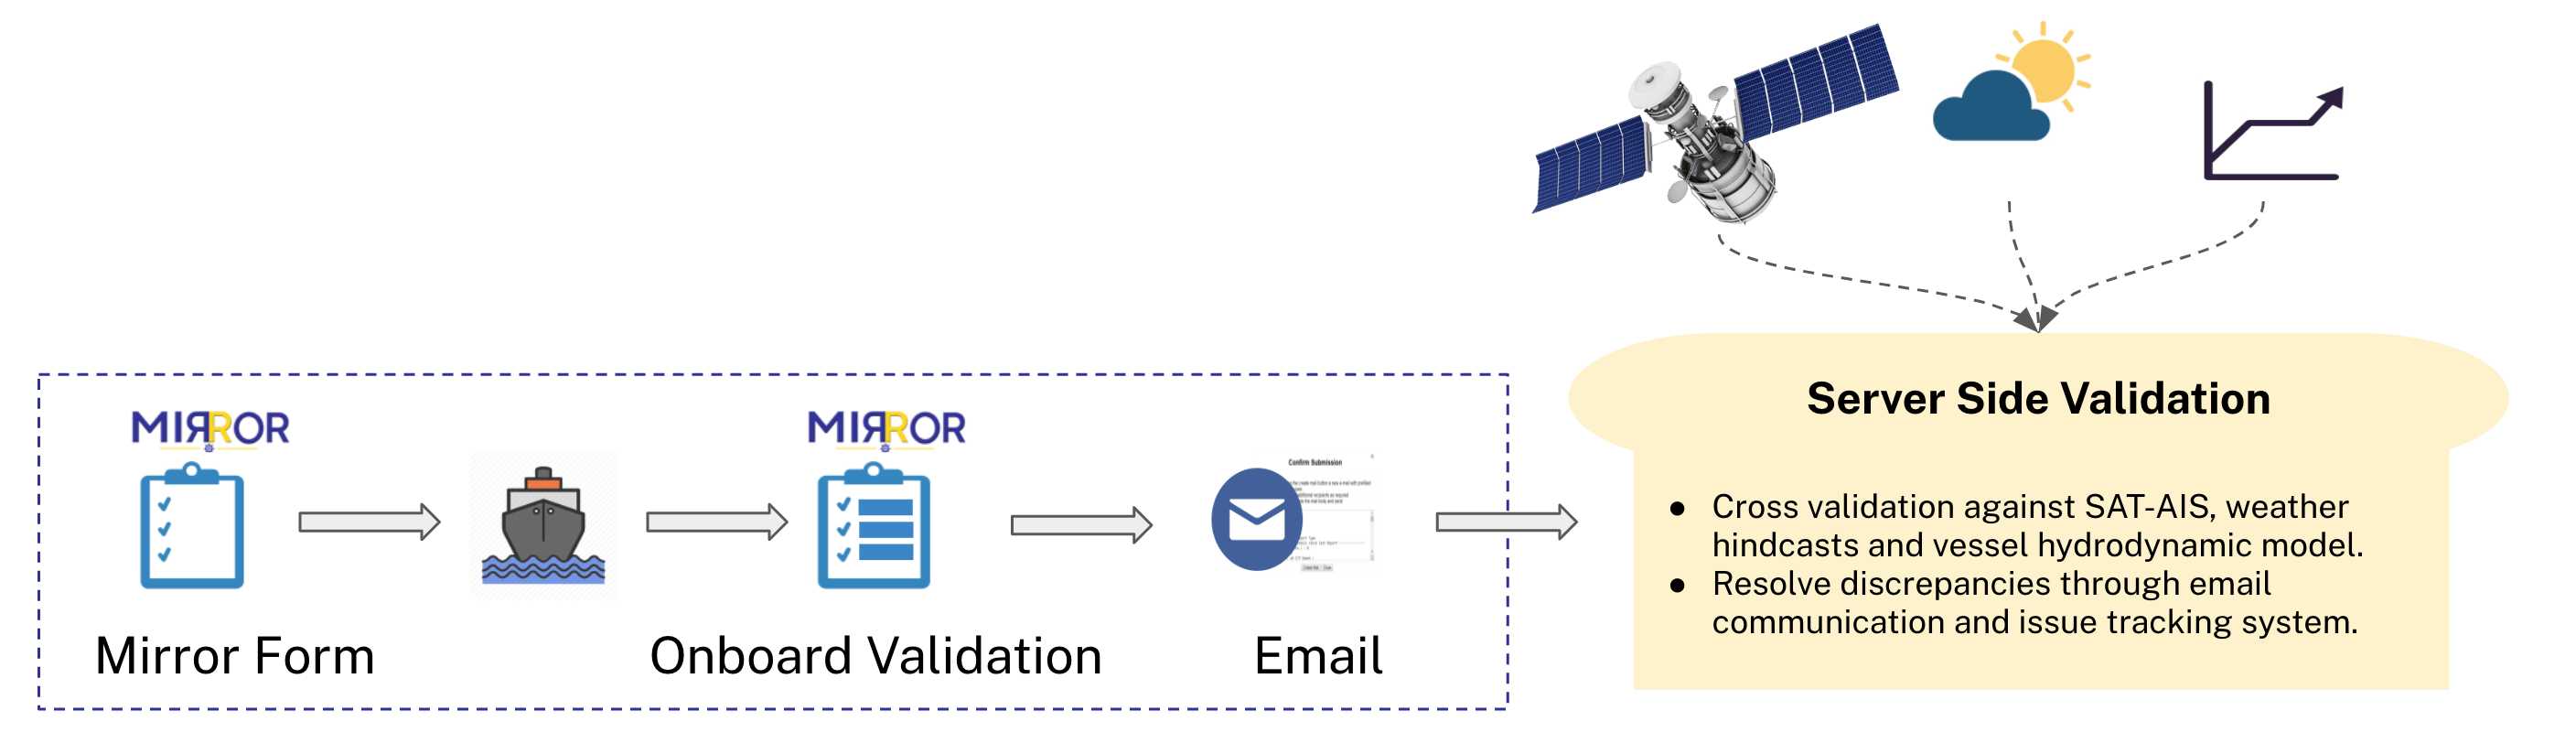
Error-free and accurate noon report data can be valuable not only for generating commercial reports but also for technical performance analysis and monitoring. To achieve this, BOSS captures noon data through our MIRROR reporting system that contains several validation layers on both the client and server-side. Objective monitoring by the BOSS team using a unique man-machine combination has drastically reduced the data reporting errors on the vessels enrolled under BOSS.
Baseline and comparison
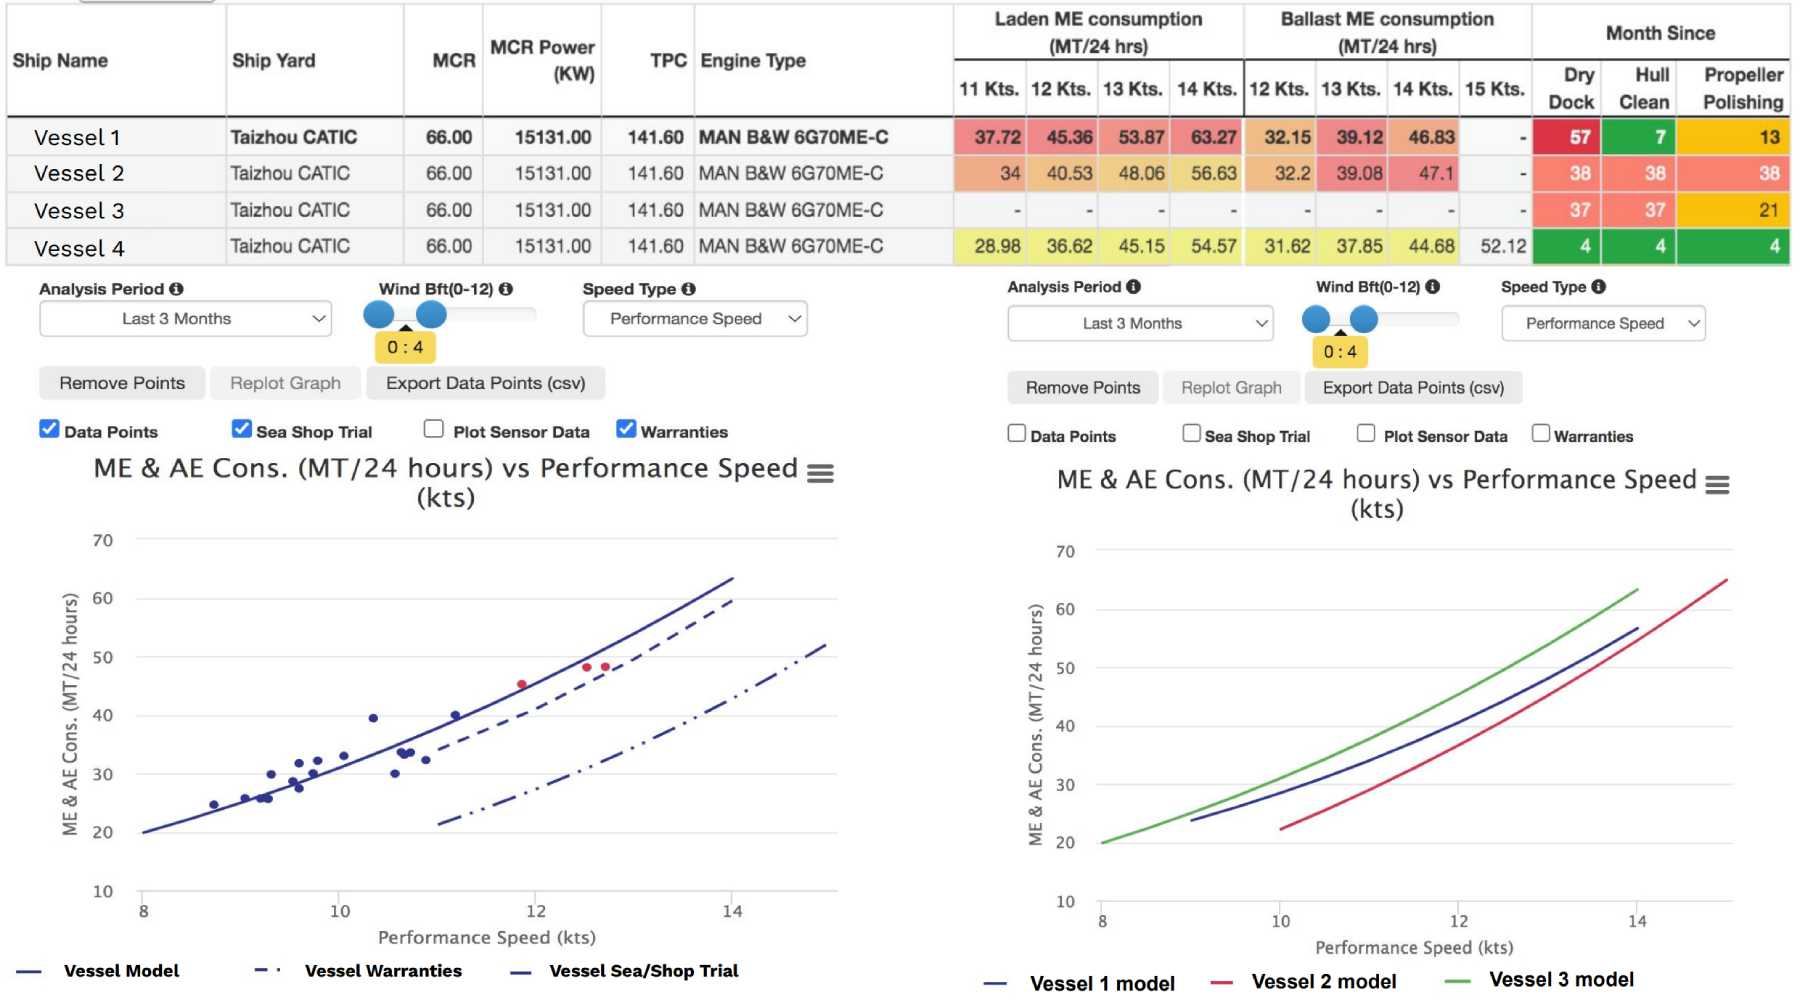
BOSS allows performance comparison against warranted consumption, sea trial data, and sister vessels. BOSS can automatically fetch the sister vessels of a given ship from our database based on vessel attributes such as engine type, hull design, shipyard, and TPC. This comparative analysis can be insightful to identify the best and worst performers in a given class, re-negotiate warranties and make voyage fixture decisions.
Transparency
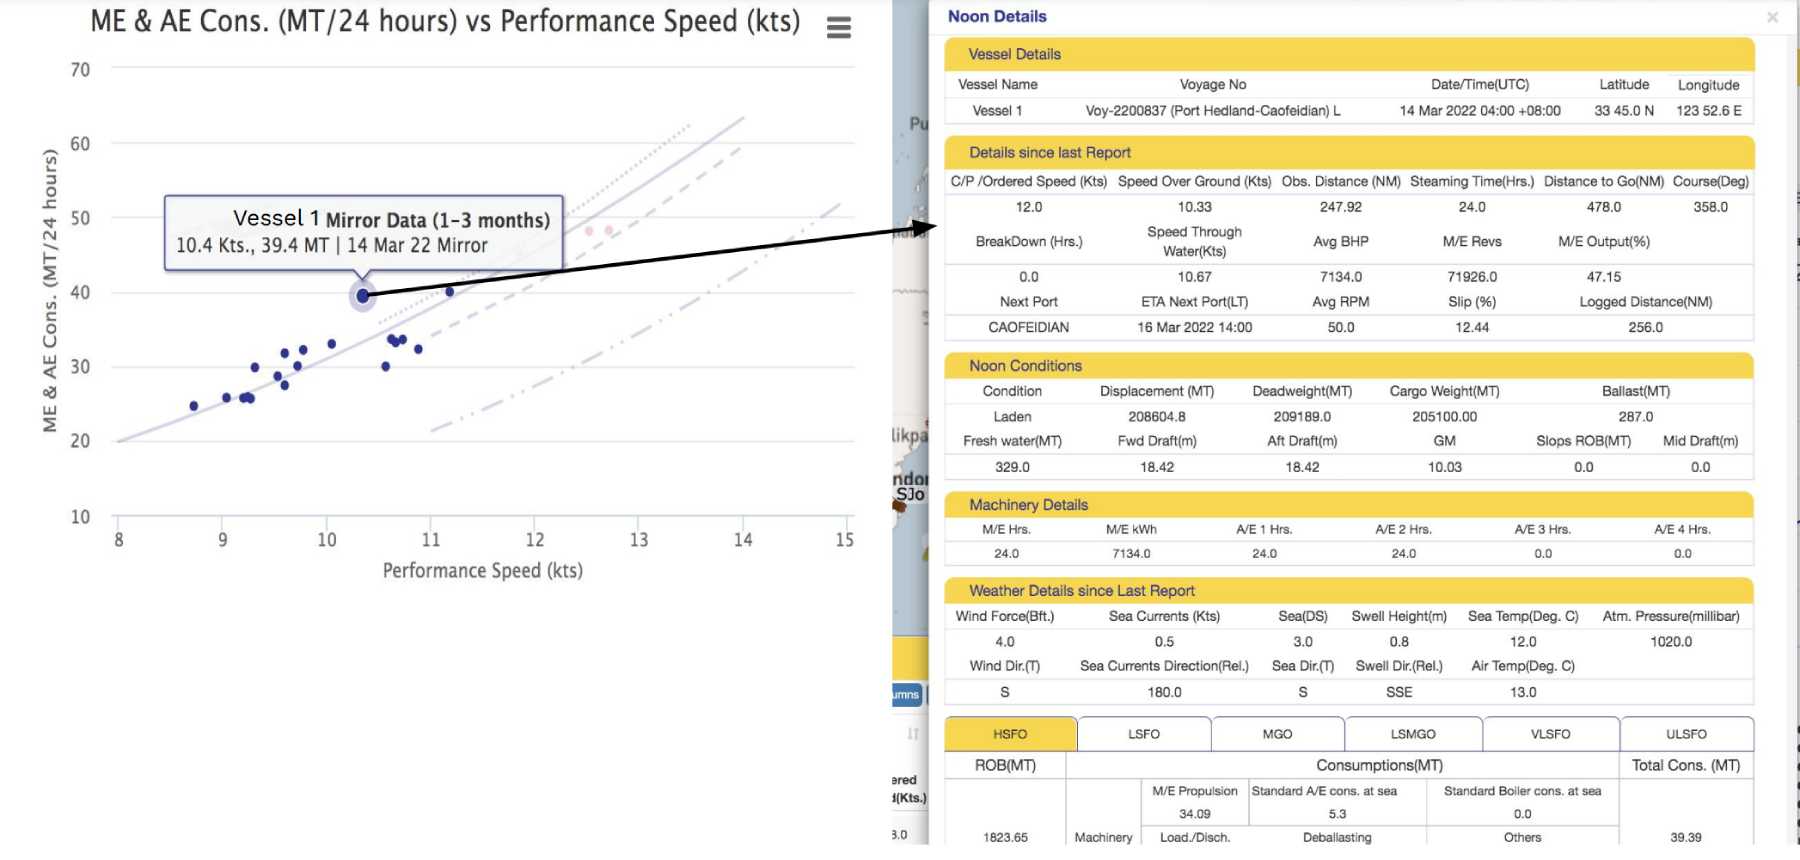
While data outliers do not make the most visually appealing vessel performance graphs, they can often offer valuable insights. For example, consider a vessel that substantially overconsumed for a couple of recent fair weather days. These noisy data points can point to an issue which can be further analyzed by viewing the detailed respective noon reports. BOSS offers a single-screen interface for inspecting any single data point on the vessel performance graph and viewing the complete noon report with remarks from the vessel and BOSS operators.
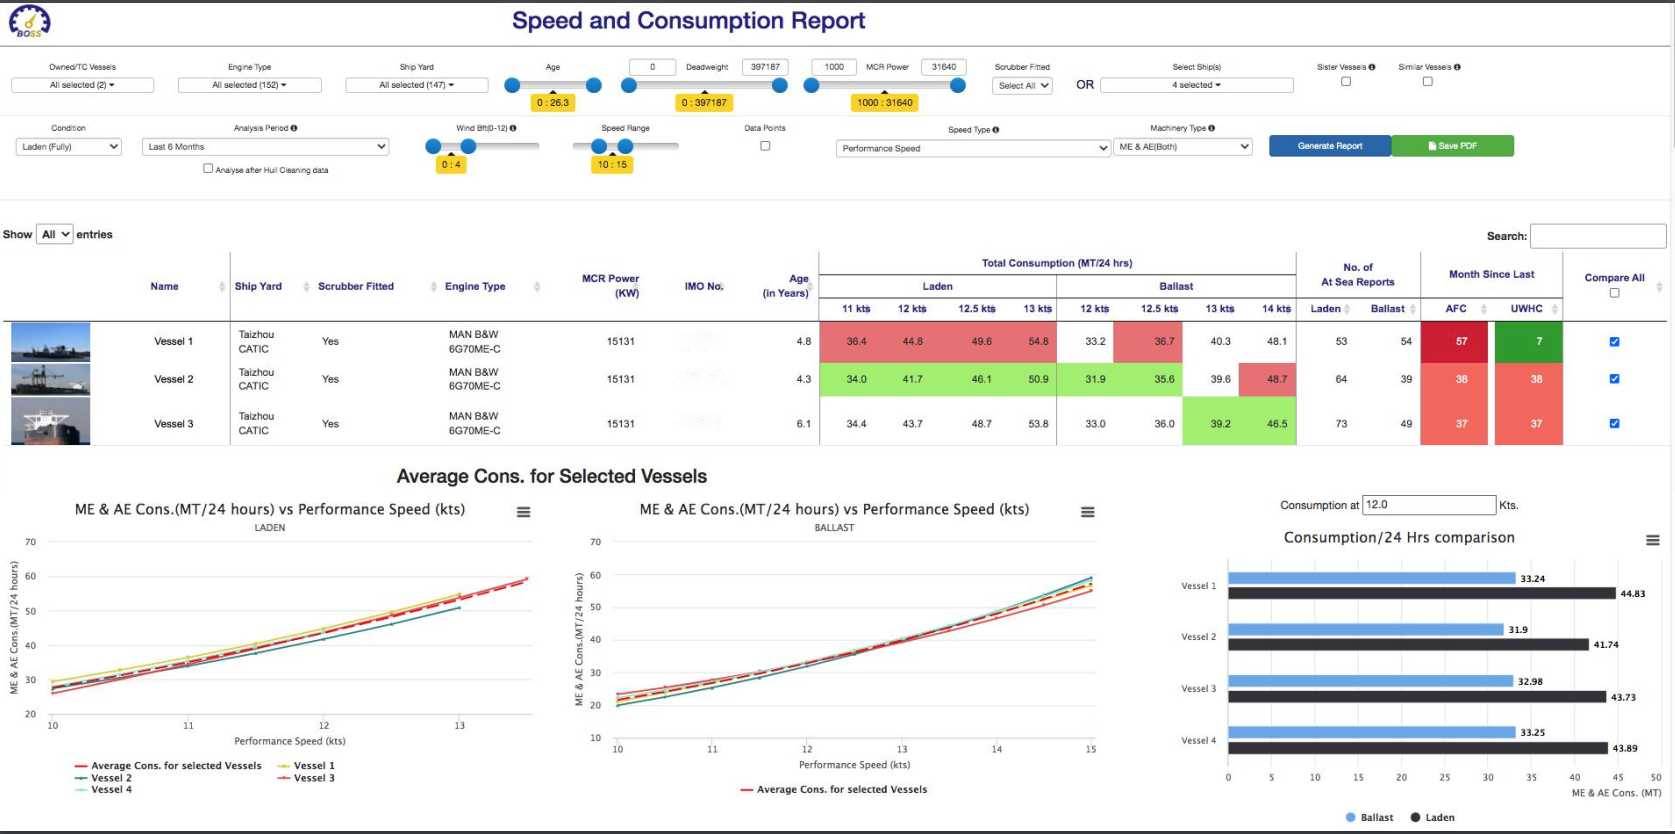
Unified View - Speed and Consumption (S&C) Report
To wrap things up, BOSS can generate the speed and consumption report of your entire fleet with the click of a button. The S&C module filters & normalizes data and fits machine learning models in real-time to generate the most accurate and updated speed and consumption report for your entire fleet. The module offers several data filtering options and vessel selection capabilities for customizing the report and making informed chartering decisions.