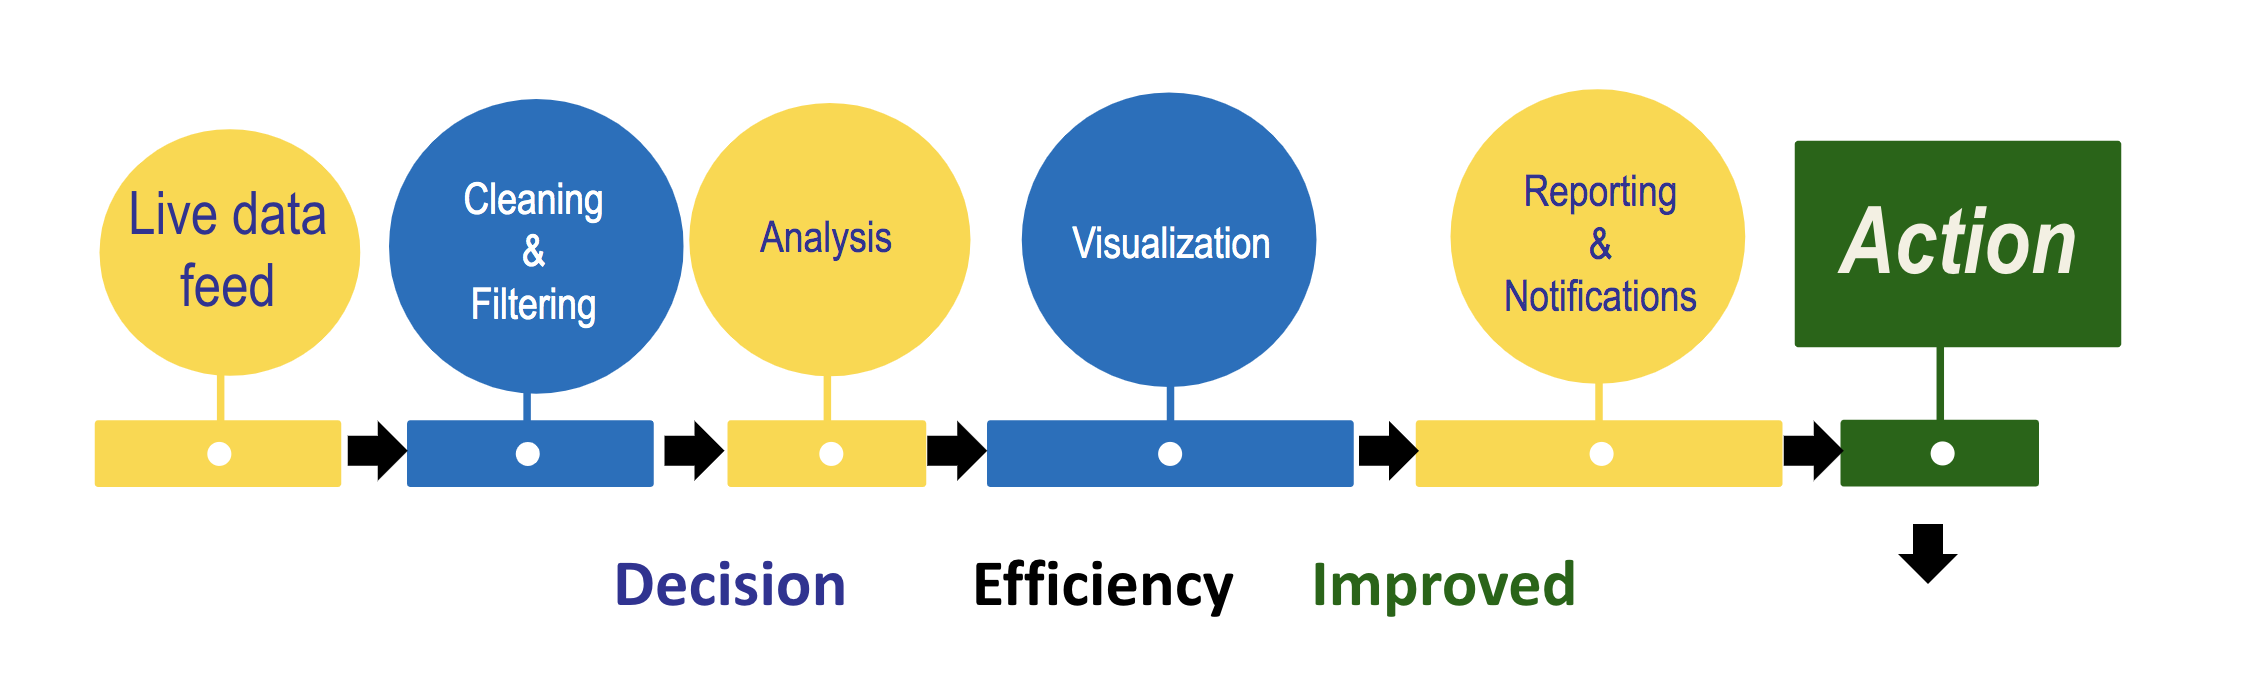
BOSS goes beyond voyage planning and management. The validated noon data combined with analyzed weather is used for deriving insights about vessel performance which can assist vessel operators to take decisions about hull cleaning, propeller polishing, and engine maintenance. Our data-analytics toolkit analyzes the relationships between engine load, fuel consumption, RPM and speed to understand the current and historic vessel performance trend.
BOSS has a dedicated module to analyze the relation between RPM, Speed and Consumption in the given fair weather criteria and given analysis time period. This information is important for the technical managers to take decisions about scheduling vessel drydocking and hull cleaning. The vessel performance curves help pin-point the fundamental cause of under-performance thus assisting in the decision making process about hull cleaning and dry-docking.
BOSS also allows the user to compare vessels in a fleet on the same scale in terms of engine, propeller and hull performance. BOSS normalizes fuel curves for each vessel in Laden and Ballast condition for any selected period. Based on the analysis, BOSS helps identify average, top and worst performers in each vessel class.
The fleet dashboard allows for various levels of abstractions:
A dashboard to compare various classes of vessels at a higher level.
A dashboard to analyze a class of vessels. Identify the top, average and worst performers in terms of engine, propeller and hull.
Vessel-dashboard that links to the vessel performance curves described above and help study the performance trend of a particular vessel over time.
The fleet Performance Dashboard gives an insight about the overall fleet performance trend and helps draw attention to the corner-cases in a group of vessels. This insight helps analyze the causes of underperformance which may include competence of vessel staff, engine health, propeller and hull condition etc, thus assisting in taking corrective steps for the same.